360 Dashboard
Welcome to Invent ERP!
The Keystone to Your Business Management.
In this article, we will cover the powerful 360 Dashboard!
Let’s get started
!https://youtu.be/7gD-dGq1Wkc?si=sfX5YhU8NsSCBsdL

1- First, navigate to the side menu.

2- Click on the Dashboard section, and then select the plus icon to display the list of dashboard items.

3- Click "Business 360 Summary".

4- The 360 Dashboard, giving you a comprehensive overview of your business operations.

Select the desired date range for analysis

Choose the date range for further insights

You will see a summary of your business sales and purchases, along with a list of your top sold products

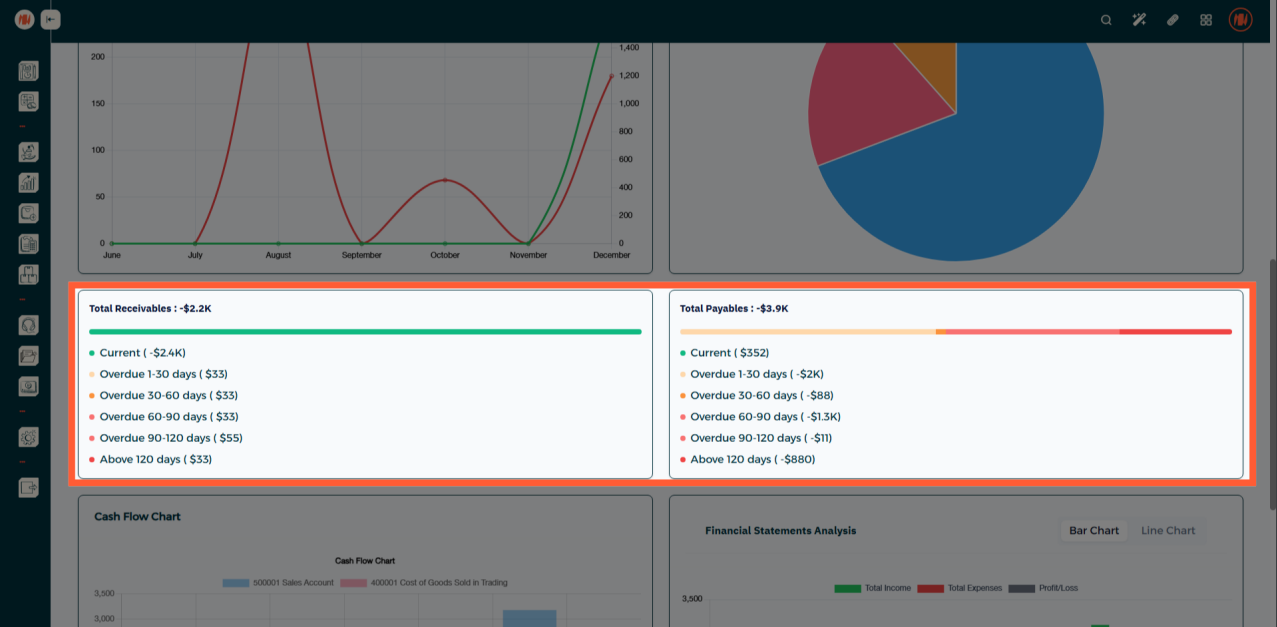
Also, you will get a summary of your business the total receivables and payables.
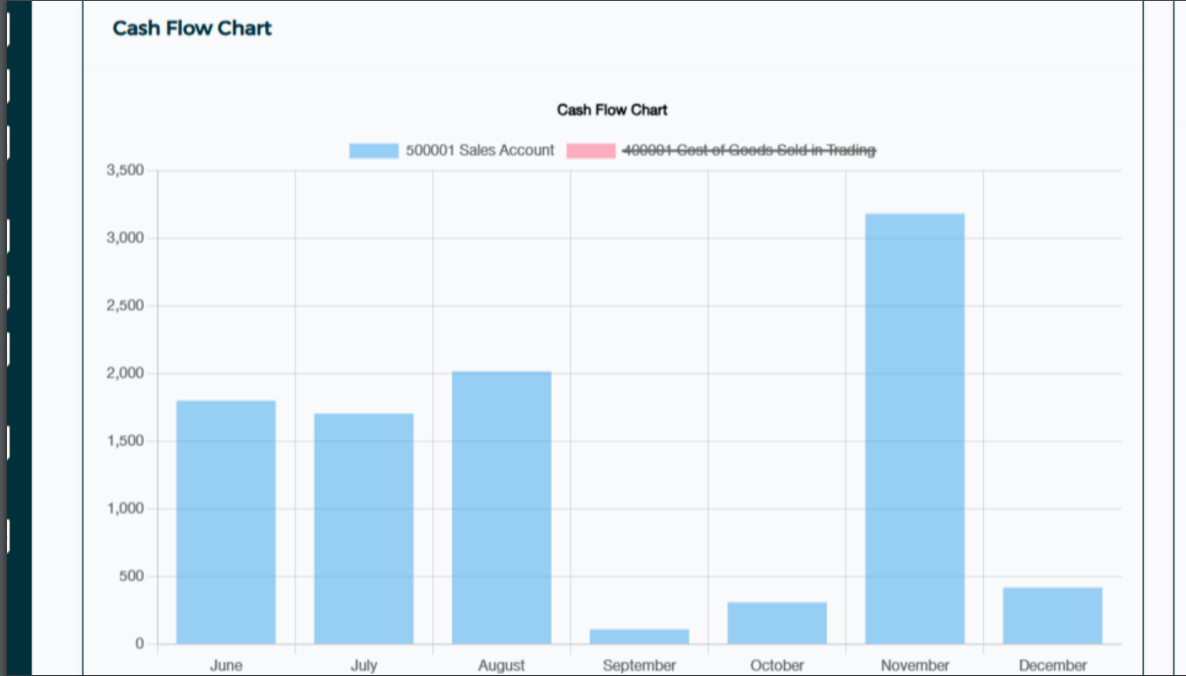
You well find a Cash Flow Chart and Financial Statements Analysis.

you can choose wither to display Sales account only

Also for the financial statements analysis an you can choose what to display based on your needs
Additionally, You can choose to display this data as a bar chart or a line chart or a line chart


Periodic Report
Furthermore, you can receive a periodic summary via email by following these steps .

Click the plus icon to display all the items


Click on the settings section

Once you are there, just configure this section, and you'll start receiving the periodic summary
for your operations via email.

That wraps up our overview of the 360 Dashboard,